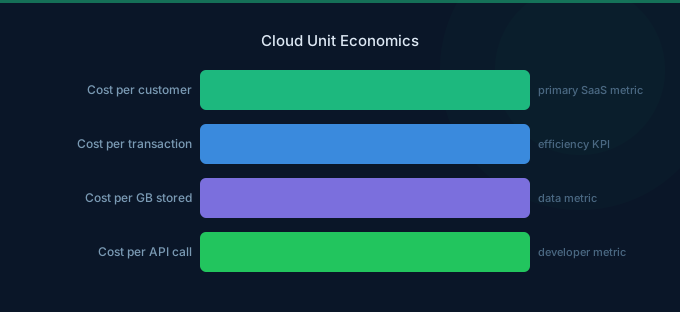
Total cloud spend tells you how much you're paying. Unit economics tells you whether that spending makes sense. A $50,000/month AWS bill means nothing in isolation. A $50,000/month bill serving 10,000 customers at $5/customer/month tells you exactly how your infrastructure scales with business growth — and whether your economics work.
Unit economics is the bridge between engineering and finance -- a core FinOps discipline. It answers the question every CFO asks: "Is our infrastructure spend proportional to our revenue, and will it improve as we scale?"
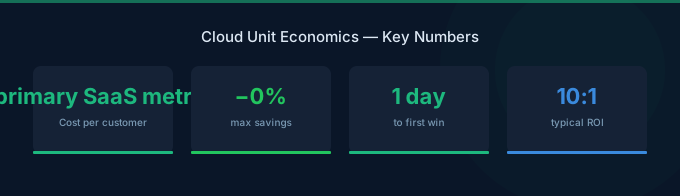
TL;DR: Unit economics metrics: cost per customer ($3-50/month depending on SaaS type), cost per transaction ($0.001-0.05), cost per API call ($0.00001-0.001), cloud as % of revenue (target under 15%). Track these monthly. They should improve over time — if cost per customer is rising, your architecture has scaling problems. The optimization goal: cloud costs should grow at 40-60% of the rate of business growth.
Core Unit Economics Metrics
Metric 1: Cost Per Customer
Formula: Monthly AWS spend / Monthly active customers
| SaaS Type | Healthy Range | Warning Signal |
|---|---|---|
| Low-compute (CRM, PM) | $2-8/customer | Over $15 |
| Standard B2B SaaS | $5-25/customer | Over $40 |
| Data/Analytics platform | $15-75/customer | Over $100 |
| AI/ML SaaS | $20-100/customer | Over $150 |
Track monthly. Cost per customer should trend downward as you scale — this demonstrates sub-linear infrastructure scaling, which is the basis of SaaS margin expansion.
Metric 2: Cost Per Transaction
Formula: Service-specific AWS cost / Number of transactions processed
Useful for: payment processors, marketplaces, logistics platforms — any business where value is measured in transactions.
| Business Type | Healthy Range |
|---|---|
| Payment processing | $0.001-0.005/transaction |
| E-commerce order | $0.01-0.05/order |
| API platform | $0.00001-0.001/call |
| Data pipeline | $0.001-0.01/record processed |
Metric 3: Cloud as Percentage of Revenue
Formula: Monthly AWS spend / Monthly revenue x 100
The executive-level metric. Benchmark by company stage and compare to industry averages.
Metric 4: Infrastructure Efficiency Ratio
Formula: Revenue growth rate / Cloud cost growth rate
| Ratio | Interpretation |
|---|---|
| Under 1.0 | Costs growing faster than revenue (bad) |
| 1.0-1.5 | Moderate efficiency |
| 1.5-2.5 | Good efficiency |
| Over 2.5 | Excellent efficiency (strong sub-linear scaling) |
How to Calculate Unit Costs on AWS
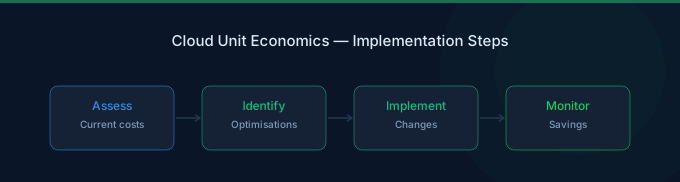
Step 1: Define Your Business Unit
Choose the unit that represents your business value:
- SaaS: Active customer or seat
- Marketplace: Transaction or order
- API platform: API call or request
- Data platform: GB processed or query executed
Step 2: Map AWS Costs to Business Units
Use AWS tags and Cost Explorer to attribute costs:
| AWS Service | Business Attribution |
|---|---|
| EC2/ECS/EKS | Application compute → divide by customers served |
| RDS/Aurora | Database → divide by customers (multi-tenant) or allocate per tenant (single-tenant) |
| S3 | Storage → allocate by tenant data volume |
| CloudFront | CDN → divide by monthly active users |
| Lambda | Functions → divide by invocations per business unit |
Step 3: Build the Dashboard
Create a monthly report tracking:
| Month | Revenue | AWS Spend | Cloud/Revenue | Active Customers | Cost/Customer |
|---|---|---|---|---|---|
| Jan 2026 | $200K | $30K | 15.0% | 2,000 | $15.00 |
| Feb 2026 | $220K | $31K | 14.1% | 2,200 | $14.09 |
| Mar 2026 | $240K | $32K | 13.3% | 2,400 | $13.33 |
This trend — improving efficiency every month — is what investors and executives want to see.
Common Unit Economics Problems
Problem 1: Linear Cost Scaling
Symptom: Costs grow at the same rate as customers. 2x customers = 2x cloud costs.
Root cause: Per-tenant resources (separate databases, dedicated instances), no caching, no shared infrastructure.
Fix: Migrate to multi-tenant architecture, add caching layers, consolidate compute.
Problem 2: Super-Linear Cost Scaling
Symptom: Costs grow faster than customers. 2x customers = 3x cloud costs.
Root cause: N+1 query problems, unindexed database queries, data that grows with the square of customers (social graphs, cross-customer analytics).
Fix: Database optimization, query indexing, architectural review of data models.
Problem 3: Flat Cost Per Customer
Symptom: Cost per customer stays constant as you scale — no efficiency gains.
Root cause: Right infrastructure choices but no commitment discounts, no Graviton adoption, no Spot utilization. The architecture scales well, but you're paying list price.
Fix: Implement Savings Plans, migrate to Graviton, use Spot for stateless workloads.
Problem 4: Falling Then Rising Cost Per Customer
Symptom: Cost per customer improved, then started increasing again.
Root cause: Usually a new feature (AI features, analytics, real-time processing) that changes the cost profile. Or a database hitting a scaling threshold that requires a larger instance tier.
Fix: Identify the new cost driver, optimize it specifically, update unit economics targets.
Making Unit Economics Actionable
For Engineering Teams
Show engineers how their architectural decisions impact unit costs:
- "This database change increases cost per customer by $0.50"
- "Switching to caching reduces cost per API call by 40%"
- "This AI feature adds $2/customer/month to infrastructure"
When engineers see costs in business terms, they make different design decisions.
For Finance Teams
Give finance the metrics they need for planning:
- Cost per customer enables infrastructure budget forecasting based on growth projections
- Cloud/revenue ratio shows efficiency trends for investor reporting
- Infrastructure efficiency ratio validates that growth is capital-efficient
For Executive Teams
Frame cloud optimization as business strategy:
- "Reducing cost per customer from $15 to $10 adds $500K/year to gross profit at current scale"
- "Our infrastructure efficiency ratio of 2.0 means revenue grows 2x faster than costs"
- "At 10,000 customers, our architecture scales more efficiently than competitors"
Related Guides
- Cloud Costs for SaaS: Benchmarks and COGS
- Cloud Tagging Strategy: Cost Management Foundation
- FinOps for Startups: Cloud Costs Without a Team
- What Is FinOps? Cloud Cost Management Guide
Frequently Asked Questions
What's a good cost per customer for SaaS?
It depends on your ARPU. Cloud cost per customer should be under 10% of ARPU. For a $50/month product, target under $5/customer. For a $500/month product, target under $30/customer. The ratio matters more than the absolute number.
How often should I measure unit economics?
Monthly at minimum. Track cost per customer, cloud/revenue ratio, and infrastructure efficiency ratio. Review quarterly with engineering and finance leadership. Include in board reporting if cloud costs exceed 10% of revenue.
What's the most important unit metric?
Cost per customer for most businesses. It ties infrastructure to the unit that generates revenue, enables forecasting, and benchmarks against industry averages. Cloud/revenue ratio is the executive summary metric, but cost per customer is more actionable.
How do I improve unit economics?
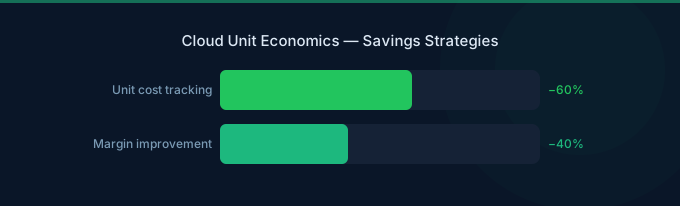
Two approaches: (1) Technical optimization — rightsizing, Graviton, Savings Plans, caching, multi-tenant architecture. (2) Architectural optimization — reduce cost per unit of business value through better design, shared infrastructure, and efficient data models. Technical optimization gives 20-40% improvement. Architectural optimization can give 2-5x improvement.
Build Unit Economics Into Your Culture
Unit economics transforms cloud costs from an engineering expense into a business metric. Start tracking today:
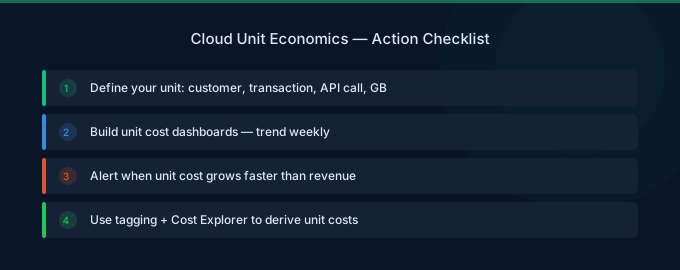
- Define your business unit — Customer, transaction, API call, or record
- Calculate current cost per unit — AWS spend divided by business units
- Set improvement targets — 5-10% reduction per quarter is achievable
- Track monthly — Build dashboards that connect AWS spend to business metrics
- Share broadly — Engineering, finance, and executives should all see unit economics