Cloud spending decisions need data, not assumptions. Whether you're building a business case for FinOps, justifying a cost optimization project, or benchmarking your AWS bill against peers, these 40 statistics provide the numbers behind cloud cost management in 2026.
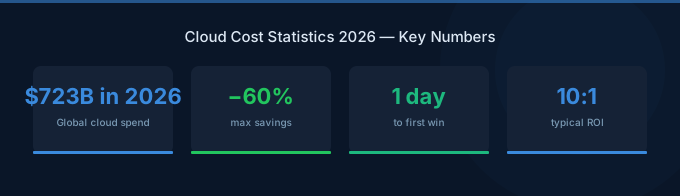
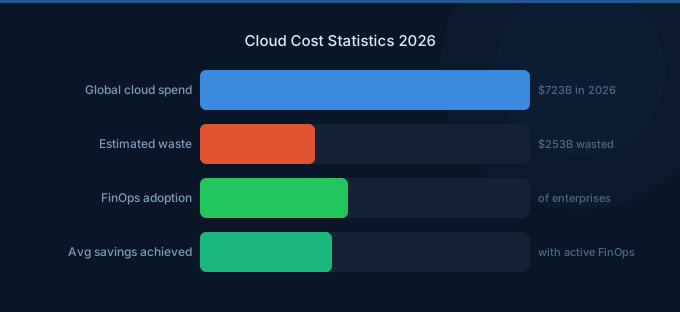
TL;DR: Global cloud infrastructure spending reached $723B in 2025 (Synergy Research Group) and is projected to exceed $840B in 2026. Organizations waste 30-35% of their cloud spend on average. AWS holds 31% market share. AI/ML workloads are the fastest-growing cost category, doubling annually. Only 45% of enterprises have a formal FinOps practice, but those that do save 20-30% on average.
Global Cloud Spending
Market Size and Growth
- Global cloud infrastructure spending reached $723 billion in 2025, growing 19% year-over-year according to the Flexera State of the Cloud Report. Cloud remains the fastest-growing segment of enterprise IT spending.
- Cloud spending is projected to exceed $840 billion in 2026, driven by AI workloads, digital transformation, and the continued shift from on-premises to cloud infrastructure.
- AWS holds approximately 31% of the global cloud infrastructure market, followed by Microsoft Azure at 25% and Google Cloud at 11%. The top three providers account for 67% of total spending.
- Enterprise cloud spending averages 30-35% of total IT budgets in 2026, up from 20-25% five years ago. For cloud-native companies, this figure exceeds 60%.
- The average enterprise manages 3.4 public cloud accounts across different providers, though 72% of workloads remain concentrated on a primary provider.
Cloud Waste and Optimization
The Waste Problem
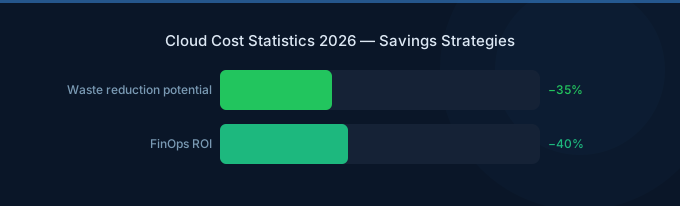
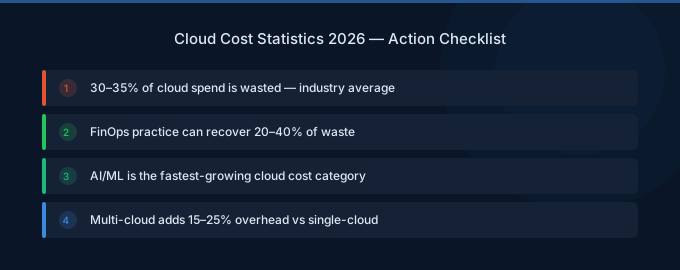
- Organizations waste an estimated 30-35% of their cloud spend on average, according to multiple industry surveys. This translates to approximately $200-250 billion in global cloud waste annually.
- Idle resources account for 10-15% of typical cloud bills. These are instances, databases, and storage volumes that are running but not actively serving any workload.
- Over-provisioned resources account for another 15-20% of waste. Instances and databases sized for peak load but running at 10-30% average utilization represent the largest single waste category.
- Only 48% of cloud instances are right-sized for their actual workload, according to industry benchmarks. The other 52% are over-provisioned by at least one size tier.
- The average EC2 instance runs at 15-25% CPU utilization. Most instances could be downsized by 1-2 tiers without performance impact.
Cost Optimization Impact
- Organizations with mature FinOps practices save 20-30% on cloud spend compared to those without formal cost management programs.
- The first round of cloud optimization typically yields 25-40% savings. Quick wins like deleting idle resources, rightsizing, and implementing Savings Plans capture the largest portion.
- Savings Plans and Reserved Instances cover only 45-55% of eligible workloads across the average enterprise. The uncovered portion runs at full On-Demand pricing.
- Graviton (ARM) instances deliver 20% cost savings with equivalent or better performance for most workloads, yet only 25-30% of eligible workloads have migrated.
- Spot instances save 60-90% on eligible compute workloads, but fewer than 20% of organizations use them for production stateless workloads.
FinOps Adoption
- 45% of enterprises have a formal FinOps practice in 2026, up from approximately 30% in 2024. Adoption is accelerating as cloud bills grow.
- The average FinOps team manages $15-25 million in annual cloud spend per practitioner. Larger organizations achieve higher ratios through automation.
- 68% of organizations cite cost visibility as their top FinOps challenge, followed by engineering buy-in (54%) and commitment optimization (47%).
- Companies with FinOps teams report 2.5x faster identification of cost anomalies compared to organizations relying on monthly bill reviews alone.
- The median FinOps practitioner salary ranges from $120,000-$160,000 in the US, reflecting the specialized nature of the role and growing demand.
AI and Cloud Costs
- AI/ML infrastructure spending is growing 85-100% year-over-year, making it the fastest-growing cloud cost category by far. GPU instances and inference APIs drive the majority of this growth.
- AI workloads represent 15-25% of total cloud spend for organizations with production AI deployments, up from 5-10% two years ago.
- LLM inference costs have decreased 80-90% over the past two years due to model efficiency improvements, smaller specialized models, and provider competition. GPT-4o-mini costs 100x less than GPT-4 did at launch.
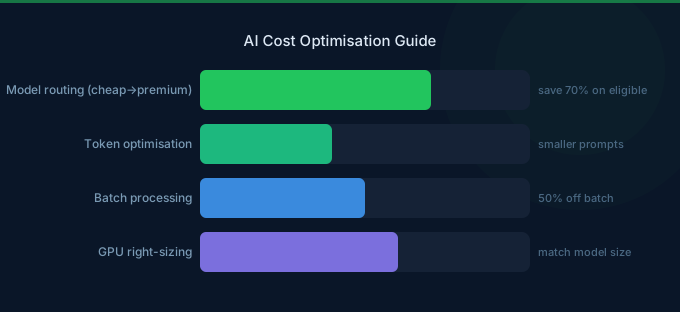
- 60-70% of AI inference spend goes to a single model in most organizations. Multi-model routing strategies that match tasks to the cheapest capable model reduce inference costs by 40-60%.
- Batch processing saves 50% on AI inference costs, yet only 25-30% of eligible AI workloads use async processing. Most organizations run everything in real-time even when latency isn't required.
AWS-Specific Statistics
- The average AWS customer spends $18,000-$22,000/month across all services. This average is heavily skewed by enterprise customers — the median is significantly lower.
- EC2 accounts for 30-40% of the average AWS bill, making it the largest single cost category for most organizations. S3 and RDS are typically the second and third largest.
- Data transfer costs surprise 75% of new AWS customers. Cross-region transfers, NAT Gateway processing, and internet egress collectively represent 10-15% of typical AWS bills.
- 83% of AWS customers use S3, making it the most widely adopted service. Lambda is used by 65% of customers, and RDS by 52%.
- AWS Savings Plans provide 30-72% savings depending on commitment term and payment option. 1-year No Upfront saves approximately 30-35%, while 3-year All Upfront saves 60-72%.
Kubernetes and Container Costs
- Kubernetes clusters waste 30-40% of provisioned compute capacity on average due to pod over-provisioning and node fragmentation.
- Pod CPU requests exceed actual usage by 3-5x in the typical cluster. Memory requests are over-provisioned by 2-3x. This is the primary driver of Kubernetes cost waste.
- Organizations running Karpenter instead of Cluster Autoscaler report 20-30% better node utilization through dynamic instance selection and automatic consolidation.
- Container adoption has reached 78% of enterprises in 2026, with Kubernetes as the dominant orchestrator at 85% market share among container users.
- EKS is the most popular managed Kubernetes service, used by 55% of Kubernetes-on-cloud deployments, followed by AKS at 30% and GKE at 25% (with overlap from multi-cloud users).
Industry Benchmarks
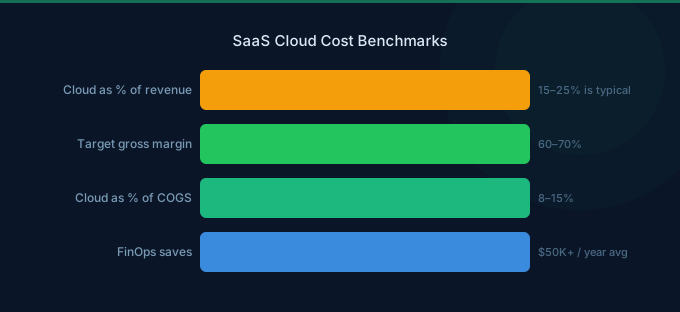
- SaaS companies spend 15-25% of revenue on cloud infrastructure on average. Well-optimized SaaS companies keep this below 15%, while hypergrowth startups often exceed 30%.
- Startups on AWS Activate credits typically see a 2-3x bill increase when credits expire, reflecting optimization debt accumulated during the free period.
- The average cloud cost optimization project has a 6-8 week payback period, making it one of the highest-ROI engineering investments available.
- Multi-cloud organizations spend 15-20% more on cloud than single-cloud organizations with comparable workloads, primarily due to data transfer costs, operational complexity, and reduced commitment discount leverage.
- 94% of enterprises plan to increase or maintain their cloud spending in 2026, with only 6% planning reductions. Optimization focus is on efficiency (spend per workload) rather than absolute reduction.
Related Guides
- State of Cloud Costs: Trends and Benchmarks
- Cloud Waste Statistics: How Much Is Really Wasted?
- What Is FinOps? Cloud Cost Management Guide
- Cloud Costs for SaaS: Benchmarks and COGS
Frequently Asked Questions
How much do companies spend on cloud computing in 2026?
Global cloud infrastructure spending is projected to exceed $840 billion in 2026. The average enterprise allocates 30-35% of its IT budget to cloud services. Individual company spending varies enormously — from a few hundred dollars per month for small startups to hundreds of millions per year for the largest enterprises.
What percentage of cloud spend is wasted?
Industry estimates consistently show 30-35% of cloud spend is wasted on idle resources, over-provisioned instances, and missed commitment discounts. This translates to approximately $200-250 billion in global waste annually.
How much can FinOps save on cloud costs?
Organizations with mature FinOps practices report 20-30% savings on cloud spend compared to those without formal cost management. The first optimization cycle typically captures 25-40% savings through quick wins like rightsizing, Savings Plans, and idle resource cleanup.
What's the biggest cloud cost driver?
For most organizations, compute (EC2, EKS, Lambda) represents 30-50% of total cloud spend. For AI-heavy organizations, inference APIs and GPU instances can represent 15-25% of total spend and are growing fastest.
Put These Numbers to Work
Cloud cost statistics tell the story: waste is systemic, optimization pays for itself quickly, and most organizations have significant untapped savings. Use these benchmarks to:
- Build a business case — Estimate your optimization potential based on the 30-35% waste benchmark
- Set targets — Aim for 20-30% savings in your first optimization cycle
- Benchmark your spend — Compare your cloud-to-revenue ratio against industry averages
- Prioritize actions — Focus on the largest cost categories first (compute, then data transfer, then storage)