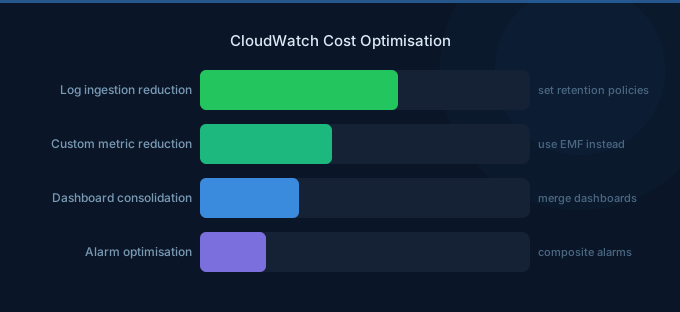
CloudWatch is often one of the most surprising costs on an AWS bill. What seems like a basic monitoring service can quietly accumulate thousands of dollars monthly through verbose logging, excessive custom metrics, and default retention policies that keep data forever. The solution isn't to monitor less — it's to monitor smarter.
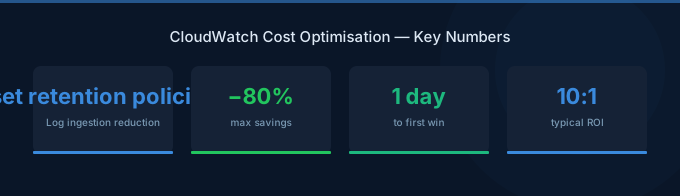
TL;DR: Three changes that save the most: (1) Set log retention periods — CloudWatch Logs stores data indefinitely by default, costing $0.03/GB/month forever. Set 30-day retention for most log groups. (2) Use metric filters instead of custom metrics where possible — avoid the $0.30/metric/month charge. (3) Send verbose logs to S3 ($0.023/GB/month) instead of CloudWatch Logs ($0.50/GB ingested + $0.03/GB stored).
CloudWatch Cost Components
| Component | Cost |
|---|---|
| Log ingestion | $0.50 per GB |
| Log storage | $0.03 per GB/month |
| Custom metrics | $0.30/metric/month (first 10K) |
| Dashboards | $3.00/month per dashboard |
| Alarms | $0.10/alarm/month (standard) |
| High-resolution alarms | $0.30/alarm/month |
| API requests | $0.01 per 1,000 GetMetricData calls |
| Contributor Insights | $0.02 per rule per match |
| Container Insights | Custom metrics pricing per node |
| Logs Insights queries | $0.0057 per GB scanned |
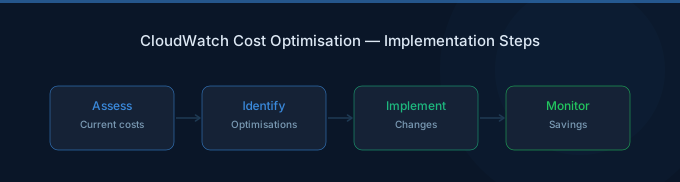
Strategy 1: Set Log Retention Policies
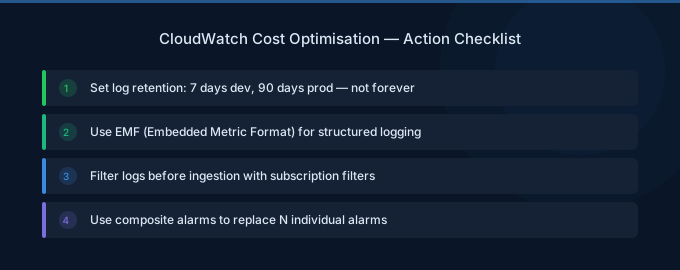
CloudWatch Logs default retention is never expire. This means every log group you've ever created is still storing data and incurring monthly charges.
| Log Type | Recommended Retention |
|---|---|
| Application debug logs | 7-14 days |
| Application info/error logs | 30 days |
| Access/audit logs | 90 days |
| Compliance/regulatory logs | 365 days or export to S3 |
Impact: A team generating 100 GB/day of logs with no retention policy accumulates 36 TB in a year, costing $1,080/month in storage alone. Setting 30-day retention limits storage to 3 TB ($90/month).
Strategy 2: Filter Logs Before Ingestion
Every byte ingested costs $0.50/GB. Reduce log volume before it reaches CloudWatch:
- Set application log levels to WARN or ERROR in production (not DEBUG or INFO)
- Use subscription filters to route only important logs to CloudWatch
- Filter out health check logs from ALB/NLB — these can be 50%+ of web server log volume
- Exclude routine cron job success output
Strategy 3: Route Verbose Logs to S3
For logs that need long-term storage but not real-time search, use CloudWatch Logs subscriptions to stream to S3 via Kinesis Data Firehose.
| Storage Option | Ingestion | Storage/GB/month |
|---|---|---|
| CloudWatch Logs | $0.50/GB | $0.03 |
| S3 Standard | $0.00 (via Firehose) | $0.023 |
| S3 Glacier | $0.00 | $0.004 |
For 1 TB/month of logs stored for 1 year, CloudWatch costs $6,360 vs S3 at $276 — a 96% reduction.
Strategy 4: Reduce Custom Metrics
Each custom metric costs $0.30/month (first 10,000). Teams using detailed monitoring or custom dimensions often create thousands of metrics without realizing it.
Common over-creation patterns:
- Per-customer metrics (1,000 customers = $300/month in metrics alone)
- Per-endpoint metrics with multiple dimensions
- High-resolution (1-second) metrics when 1-minute suffices
Alternatives:
- Use CloudWatch Embedded Metric Format (EMF) — publish metrics through logs at log ingestion rates
- Aggregate metrics before publishing (per-service instead of per-instance)
- Use metric math instead of publishing calculated metrics
Strategy 5: Optimize Container Insights
Container Insights publishes custom metrics for every ECS task/EKS pod. For clusters with hundreds of pods, this creates thousands of custom metrics.
Cost control:
- Disable Container Insights on dev/staging clusters
- Use enhanced observability selectively — only for namespaces that need it
- Consider third-party tools (Prometheus + Grafana) for large clusters — they're often cheaper than Container Insights at scale
- Review recommendations from AWS Cost Management for additional monitoring savings
Strategy 6: Right-Size Alarms
| Alarm Type | Cost/month | When to Use |
|---|---|---|
| Standard resolution (60s) | $0.10 | Most production monitoring |
| High resolution (10s) | $0.30 | Only for latency-critical services |
| Composite alarms | $0.50 | Reduce alarm noise |
Audit alarms quarterly. Delete alarms for decommissioned services and resources.
Related Guides
- AWS CloudWatch Pricing: Metrics, Logs, and Costs
- Cloud Cost Optimization Checklist
- Cloud Tagging Strategy Guide
- AWS EC2 Cost Optimization: 12 Proven Strategies
FAQ
How can I find which log groups cost the most?
In the CloudWatch console, go to Log Groups and sort by stored bytes. Or use the AWS CLI: aws logs describe-log-groups --query 'sort_by(logGroups, &storedBytes)[-10:]' to find the top 10 largest log groups.
Is CloudWatch Logs cheaper than Datadog or Splunk?
For ingestion, CloudWatch at $0.50/GB is comparable to Datadog ($0.10/GB ingested + higher retention costs). For small volumes under 100 GB/month, CloudWatch is simpler and cheaper. For large volumes, S3 + Athena is the cheapest option.
Should I use CloudWatch Logs Insights or Athena for log analysis?
Logs Insights ($0.0057/GB scanned) is best for ad-hoc queries on recent logs. For routine analysis on large historical datasets, export to S3 and query with Athena ($5/TB scanned with partition pruning) — it's cheaper for large-scale analysis.